ANALYSIS
Understanding traffic congestion
A team project combining traffic and weather records to investigate congestion patterns with linear regression.
Looking for patterns before interpreting a model
This team analysis examined how traffic and weather observations relate within a shared time period. The work combined exploratory charts with a linear-regression workflow, using aligned records and encoded road information to prepare the model inputs.
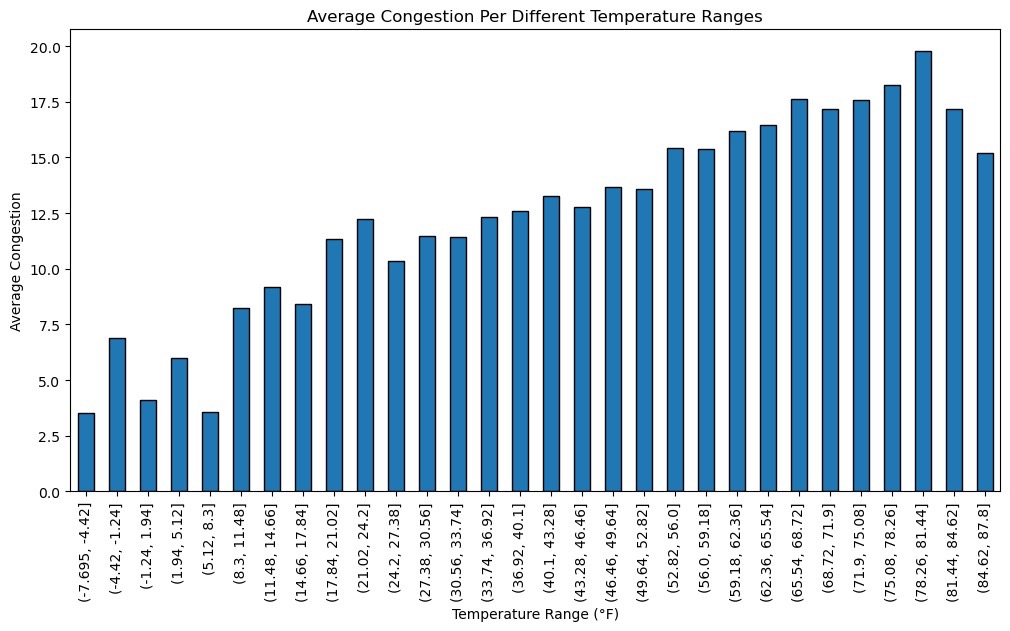
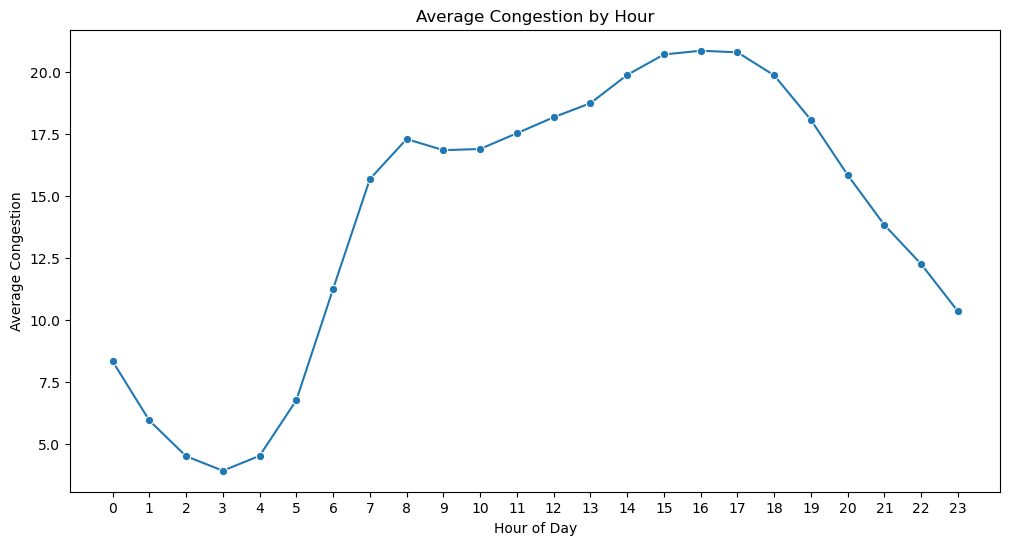
Hourly summaries show when congestion tends to differ in the sample, while weather summaries group observations by conditions such as temperature and snowfall. These comparisons help describe the dataset and frame modeling questions. They do not by themselves establish that a weather condition caused a change in traffic.
The work
The team aligned traffic and weather records to the same year, added a snow indicator, encoded categorical road information, and trained a linear regression model with an 80/20 train–test split.
The output
Correlation analysis, temperature and snowfall summaries, prediction exports, and visualizations exploring the relationship between weather and congestion.
Explore the saved analysis
Compare the hourly chart with the temperature chart. The first groups observations by time of day; the second groups them by temperature range. Read the axes and compare the relative heights, then consider how time, road conditions, and the mix of observations could affect the averages. These are saved charts from the team report, rather than a live prediction service.