PROTOTYPE
Traffic pattern prediction
I built a Python prototype to explore traffic forecasting by combining traffic and weather data, training an XGBoost model, and visualizing predictions.
- 21,360 rows in saved prototype dataset
Building a forecasting workflow
This prototype brings data preparation, feature engineering, model training, and visualization into one workflow. It explores how traffic observations and weather records can be turned into a structured dataset for time-based analysis.
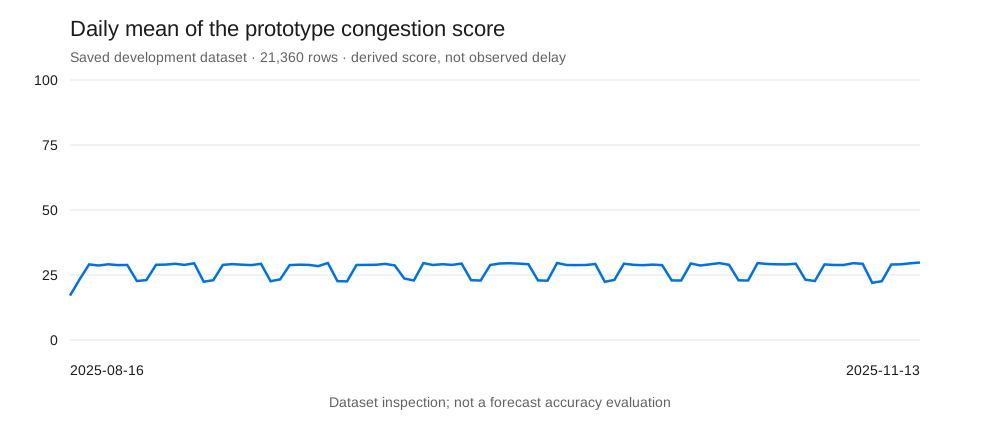
Lag features describe earlier observations, while rolling features summarize recent conditions. These inputs help frame traffic as a sequence rather than a collection of unrelated rows. The saved dataset and visualizations make that preparation inspectable, but the derived congestion score is a project-specific measure rather than a validated operational traffic index.
My contribution
I built the full prototype, from processing NYC DOT traffic and weather records to engineering lag and rolling features, XGBoost training, and Plotly forecast scripts. The pipeline also supports MTA congestion-zone entry data.
The output
Training and forecast-visualization scripts for exploring congestion over time. The prototype uses a derived congestion score and illustrative map coordinates; it is an exploration of the modeling workflow.
Explore the prototype data
Choose a date to see its mean derived congestion score and the number of records behind that average. Compare several dates and note that a day with fewer observations has less underlying coverage. The chart gives the wider timeline; the selector lets you inspect one day at a time. This view reads saved aggregates and does not train or run a forecasting model.